Zebrafish husbandry
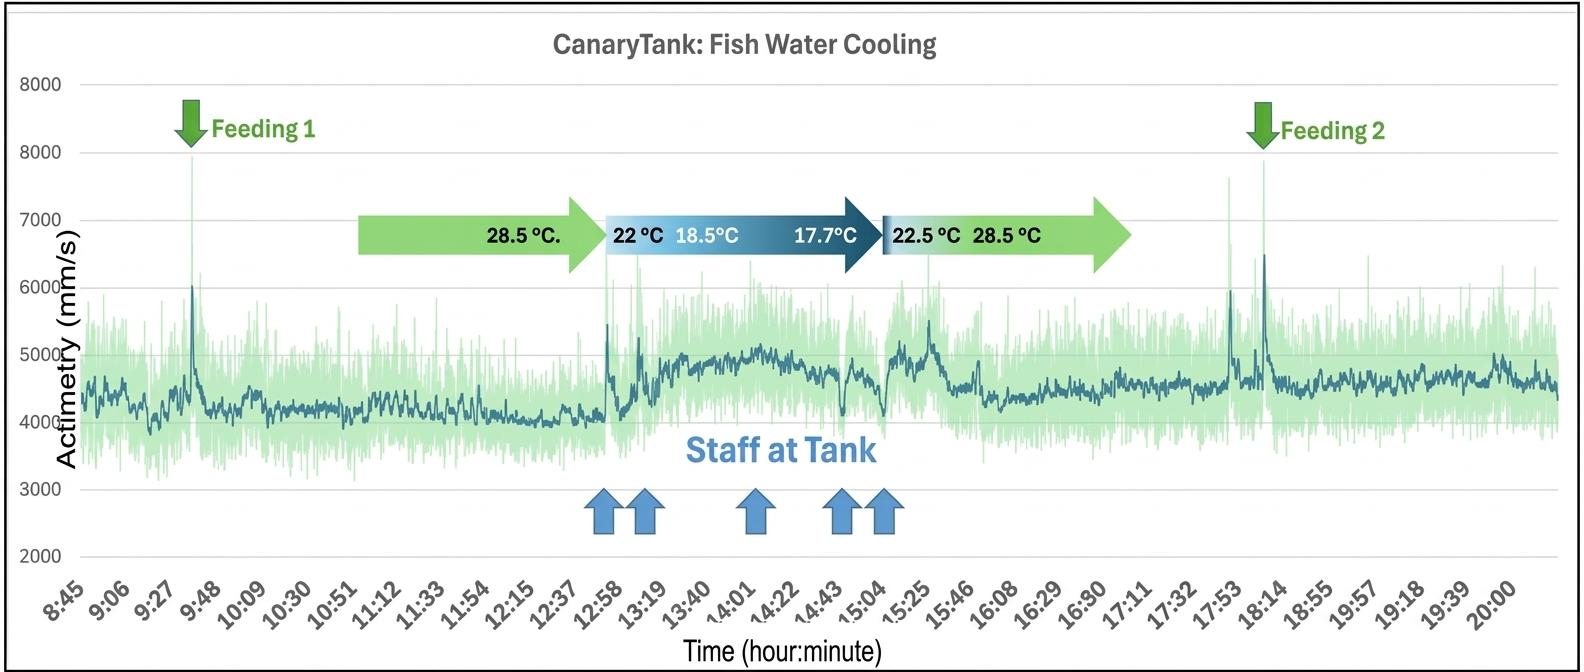
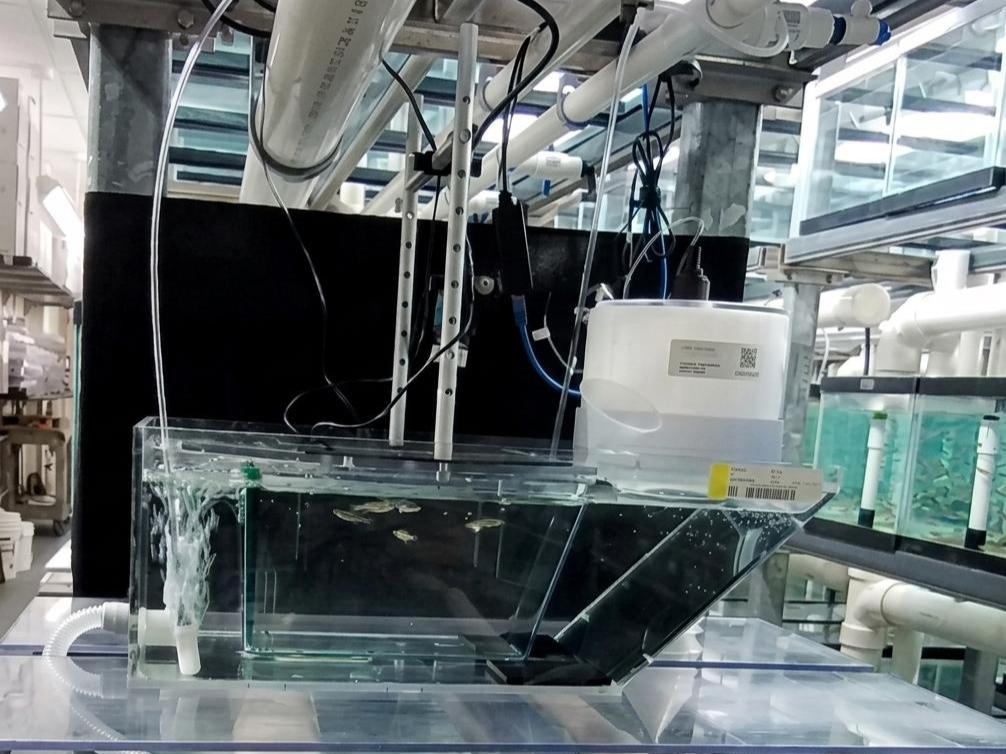
Behavior is one of the earliest signs of trouble in a fish colony. CanaryTank watches your sentinel fish continuously, so problems are caught between inspections rather than after clinical signs appear.
See the ZIRC deployment
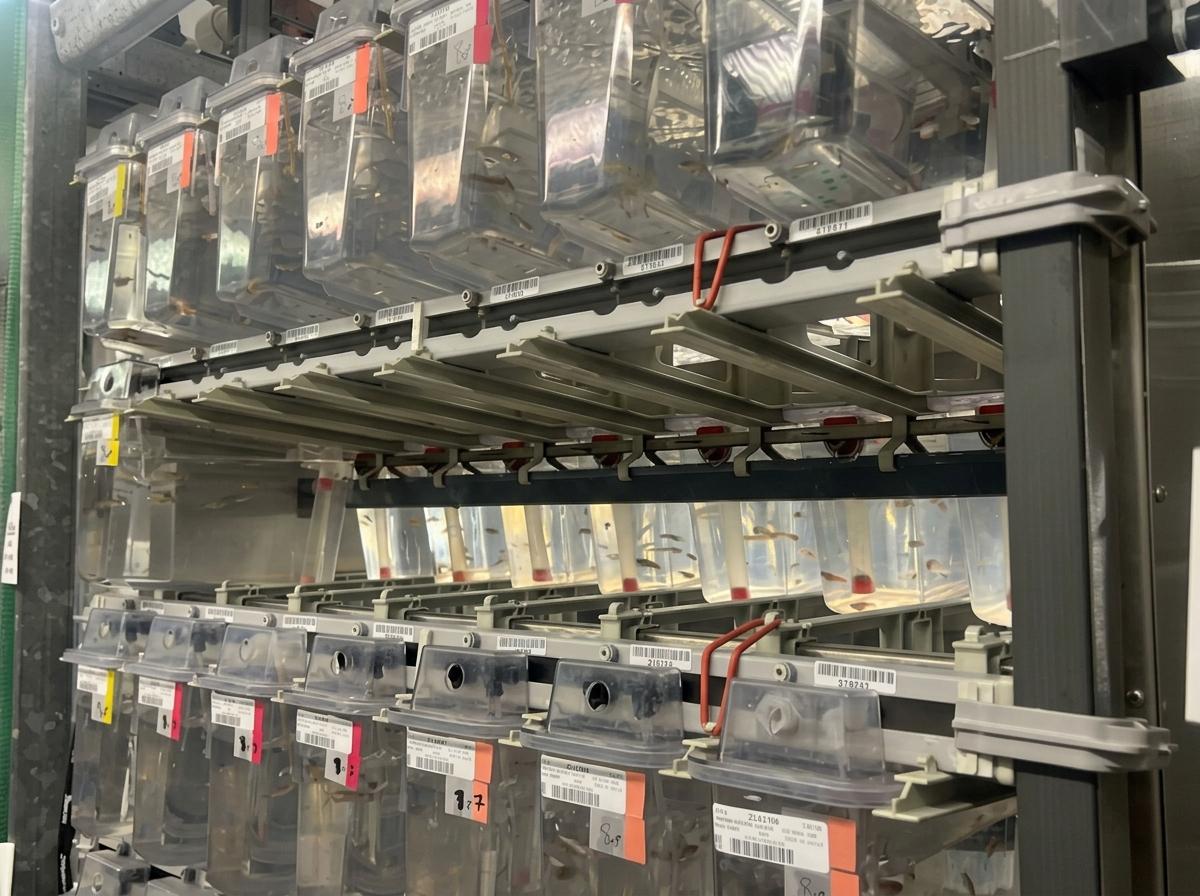
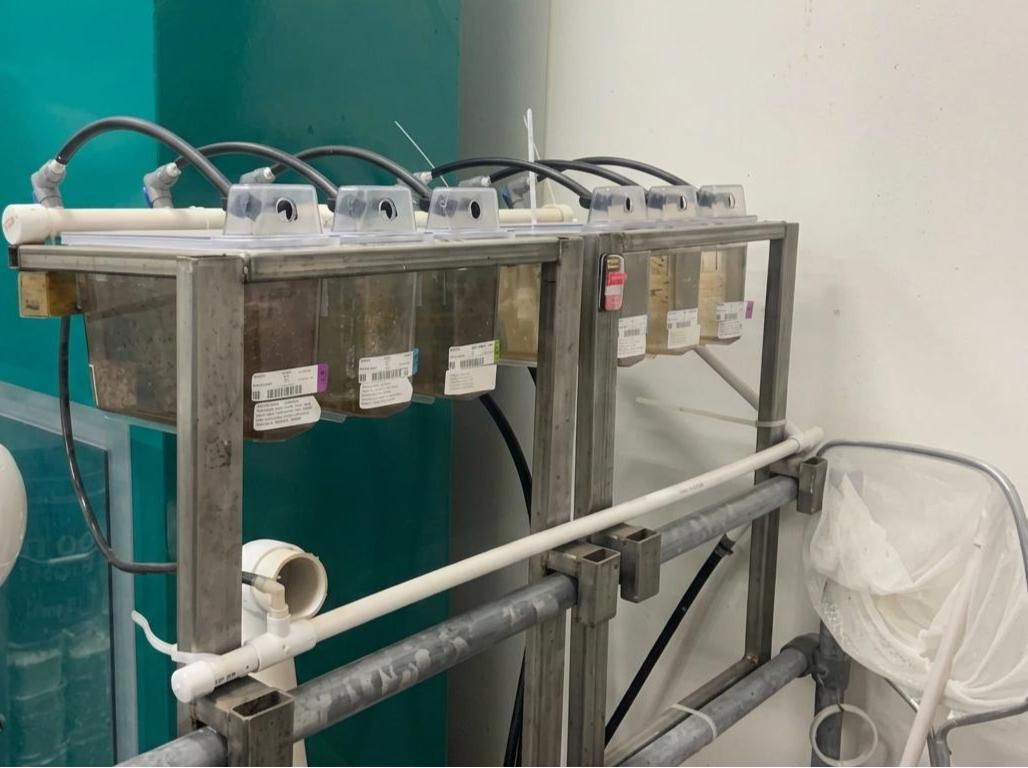
How a 4,500-tank resource center uses CanaryTank for sentinel monitoring.
Current zebrafish monitoring is blind to many important factors
To protect fish and colony health, facilities primarily monitor water quality (temperature, pH and salinity) through periodic sampling, and rely on intermittent visual inspection and post-mortem assessment of sentinel populations. This leaves many potentially critical issues undetected. Brief environmental disturbances, system malfunctions and subtle behavioral changes, which may occur frequently and even regularly, are easily missed by human inspection, yet can significantly affect animal health and well-being.
Animal behavior, including that of zebrafish, provides critical signals of health, wellness and stress. It can reveal underlying problems such as pathogens, adverse environmental conditions or microbiome imbalances, which ultimately affect husbandry standards and the rigor and reproducibility of research done with these fish.
Until CanaryTank, no computer-vision system monitored these often subtle behavioral changes continuously. Facilities were left vulnerable to undetected health problems and lacked the behavioral baseline needed for scientific or AI-driven characterization.
A sentinel population under continuous watch
- Continuous recording of the sentinel population, 24/7, through light and dark cycles
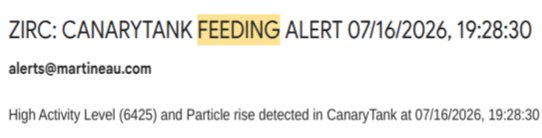
- Real-time detection of feeding events, light-regime changes and other user-defined events, with email alerts within seconds
- A behavioral baseline built up over days, weeks and years, so you can see whether today is normal
- Replay on demand: when a chart shows something unusual, check it against the recorded images
- Correlation with facility sensors, for example shelf-vibration sensors, on the same timeline
- Self-installed: one package, pre-aligned optics, no on-site tuning
The briefest disturbances and the slowest shifts