PiscisTrack™
The software and data interface included with every CanaryTank™ and MagnaTank™. It records, analyzes and stores imagery around the clock, sends alerts in real time, and gives you the data in the dashboard, as downloads, or through interfaces to your own software and AI tools.
A browser-based window on your fish
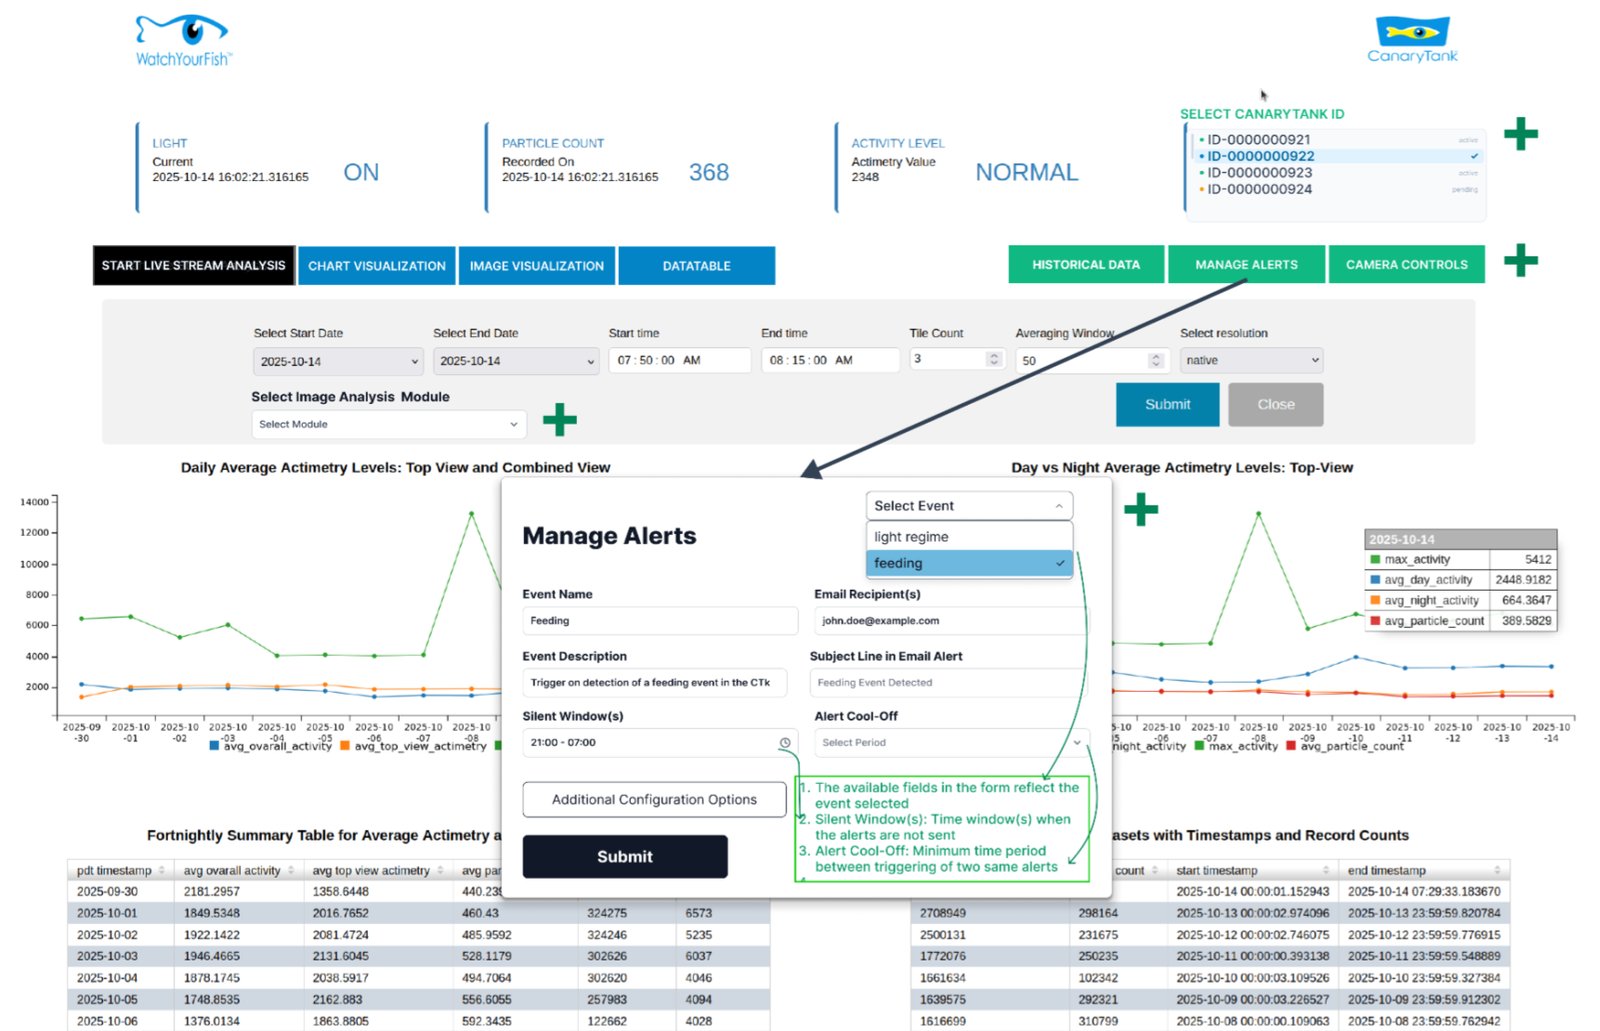
The dashboard shows current fish activity, the facility's light/dark state and charts summarizing the past 14 days. A live window shows images as they are recorded and analyzed.
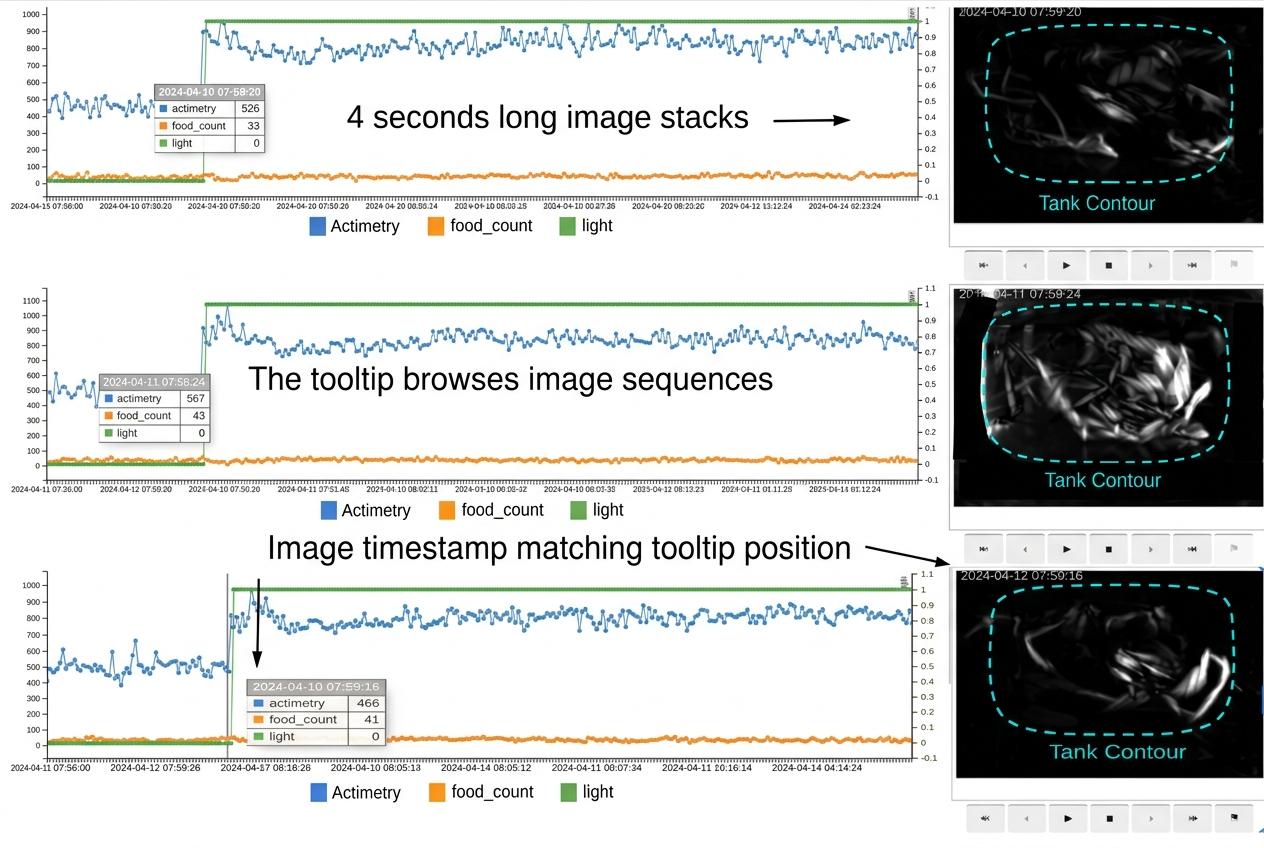
- Query any time segment at any resolution, then replay the imagery with a cursor moving along the chart
- Compare the same window across several days, synchronized or offset to align events such as feeding
- Stack imagery into visual summaries of activity and place preference
- Chart facility sensor data, such as vibration, alongside fish activity
- Download analyzed data as CSV
- Configure email alerts by event type
Coming next In development: image and data annotation, choosing analysis modules from a list, retrieving historical imagery from cloud storage, and alert parameters with silent windows and cool-off periods.
Quantitative, exportable, replayable
Zebrafish behavior has no single accepted set of standard detection methods, and most studies rely on custom statistical analysis. PiscisTrack therefore gives you the underlying motion data in a form you can analyze your own way.
Per image
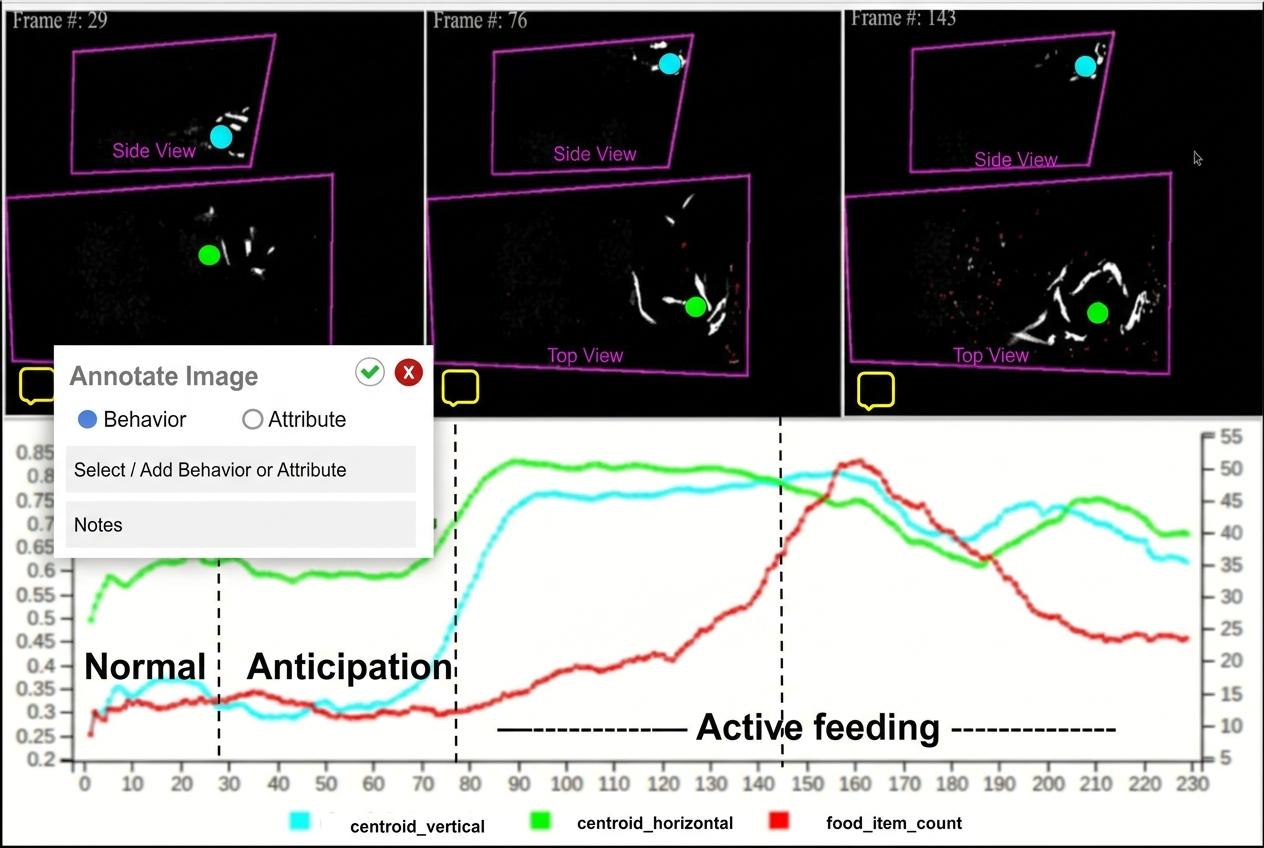
Group activity, particle counts, vertical and horizontal group position. For each fish: position and distance moved during the exposure, which gives average speed.
Per experiment
Choose any time segment and resolution, compare days with or without an offset around events such as feeding, and download analyzed data as CSV for your own statistics.
Your own tools In development
Interfaces to established behavior-analysis software and to cloud AI services, so you can apply your lab's methods to the imagery. Details below.
Every number is traceable to an image
Click a time stamp on a chart and the matching imagery plays alongside it. Since each image records motion directly, you can check what the fish were doing at any data point, on any recorded day, without searching through hours of video.
Imagery and data are retained, so past recordings can be re-analyzed later with new methods.
Open to your software and to AI services
CanaryTank should fit into your lab's workflow. Whatever analysis method you use, including new AI-based ones, CanaryTank can work on richer motion data than conventional video provides.
What this enables In development
- External processing pipelines: connections to cloud AI services, set up automatically, for example AWS SageMaker or Google Cloud Vertex AI
- Third-party behavior-analysis software: interfaces to established packages already in use in zebrafish labs
- Licensed data access: access to recorded imagery and analyzed data for algorithm developers, under data-licensing terms
- Model portability: trained models exported in an open format, to run on your CanaryTank server or elsewhere
Human-verifiable data to train on
AI models for behavior analysis are only as good as the data they learn from. Most video-derived labels are hard to check: confirming a trajectory means stepping through many frames, and the labels often come from another opaque model. CanaryTank data is different:
- The motion is in the image. Each image shows every trajectory as a visible trail, so a person can verify an extracted path, position or movement by looking at a single image.
- The processing is mechanistic. Trajectories and measurements come from a transparent geometric method, so they are reproducible and auditable, not the output of another black box.
- Every data point links to its image. The dashboard replays the exact imagery behind any chart point, so results can be audited at any scale.
- The record is continuous. Recording 24/7 over months captures normal days, rare events and slow shifts: the full range a model needs to see.
- Experts can add meaning. Planned annotation tools will let users tag behaviors and attributes on images and data, adding expert labels to the measured ones.
Available now and coming next
| Area | Available now | In development |
|---|---|---|
| Recording & analysis | 24/7 recording; real-time measurements on every image (activity, particle counts, group position, per-fish position and displacement) | Individual fish tracking across images; faster analysis with neural networks |
| Alerts | Email alerts for feeding and light-regime events within seconds | User-selectable alert types with detection parameters, silent windows and cool-off periods |
| Dashboard | Live view; 14-day summaries; multi-day charts with synchronized replay; sensor overlays; CSV download | Image and data annotation; analysis-module selection; custom processing parameters |
| Storage | Local network storage with long-term archiving | On-demand cloud storage and retrieval by service level |
| Interoperability & AI | Data export | External processing pipelines to cloud AI services; third-party software interfaces; licensed data access |
Developing behavior-analysis algorithms?
We are interested in collaborations with algorithm and AI developers who want access to continuous, human-verifiable zebrafish behavior data.